Tomogram analysis · Academic project
Auto-CryoET
Terminal tool for automated, unsupervised analysis of cryo-electron microscopy tomograms using discrete Morse theory.
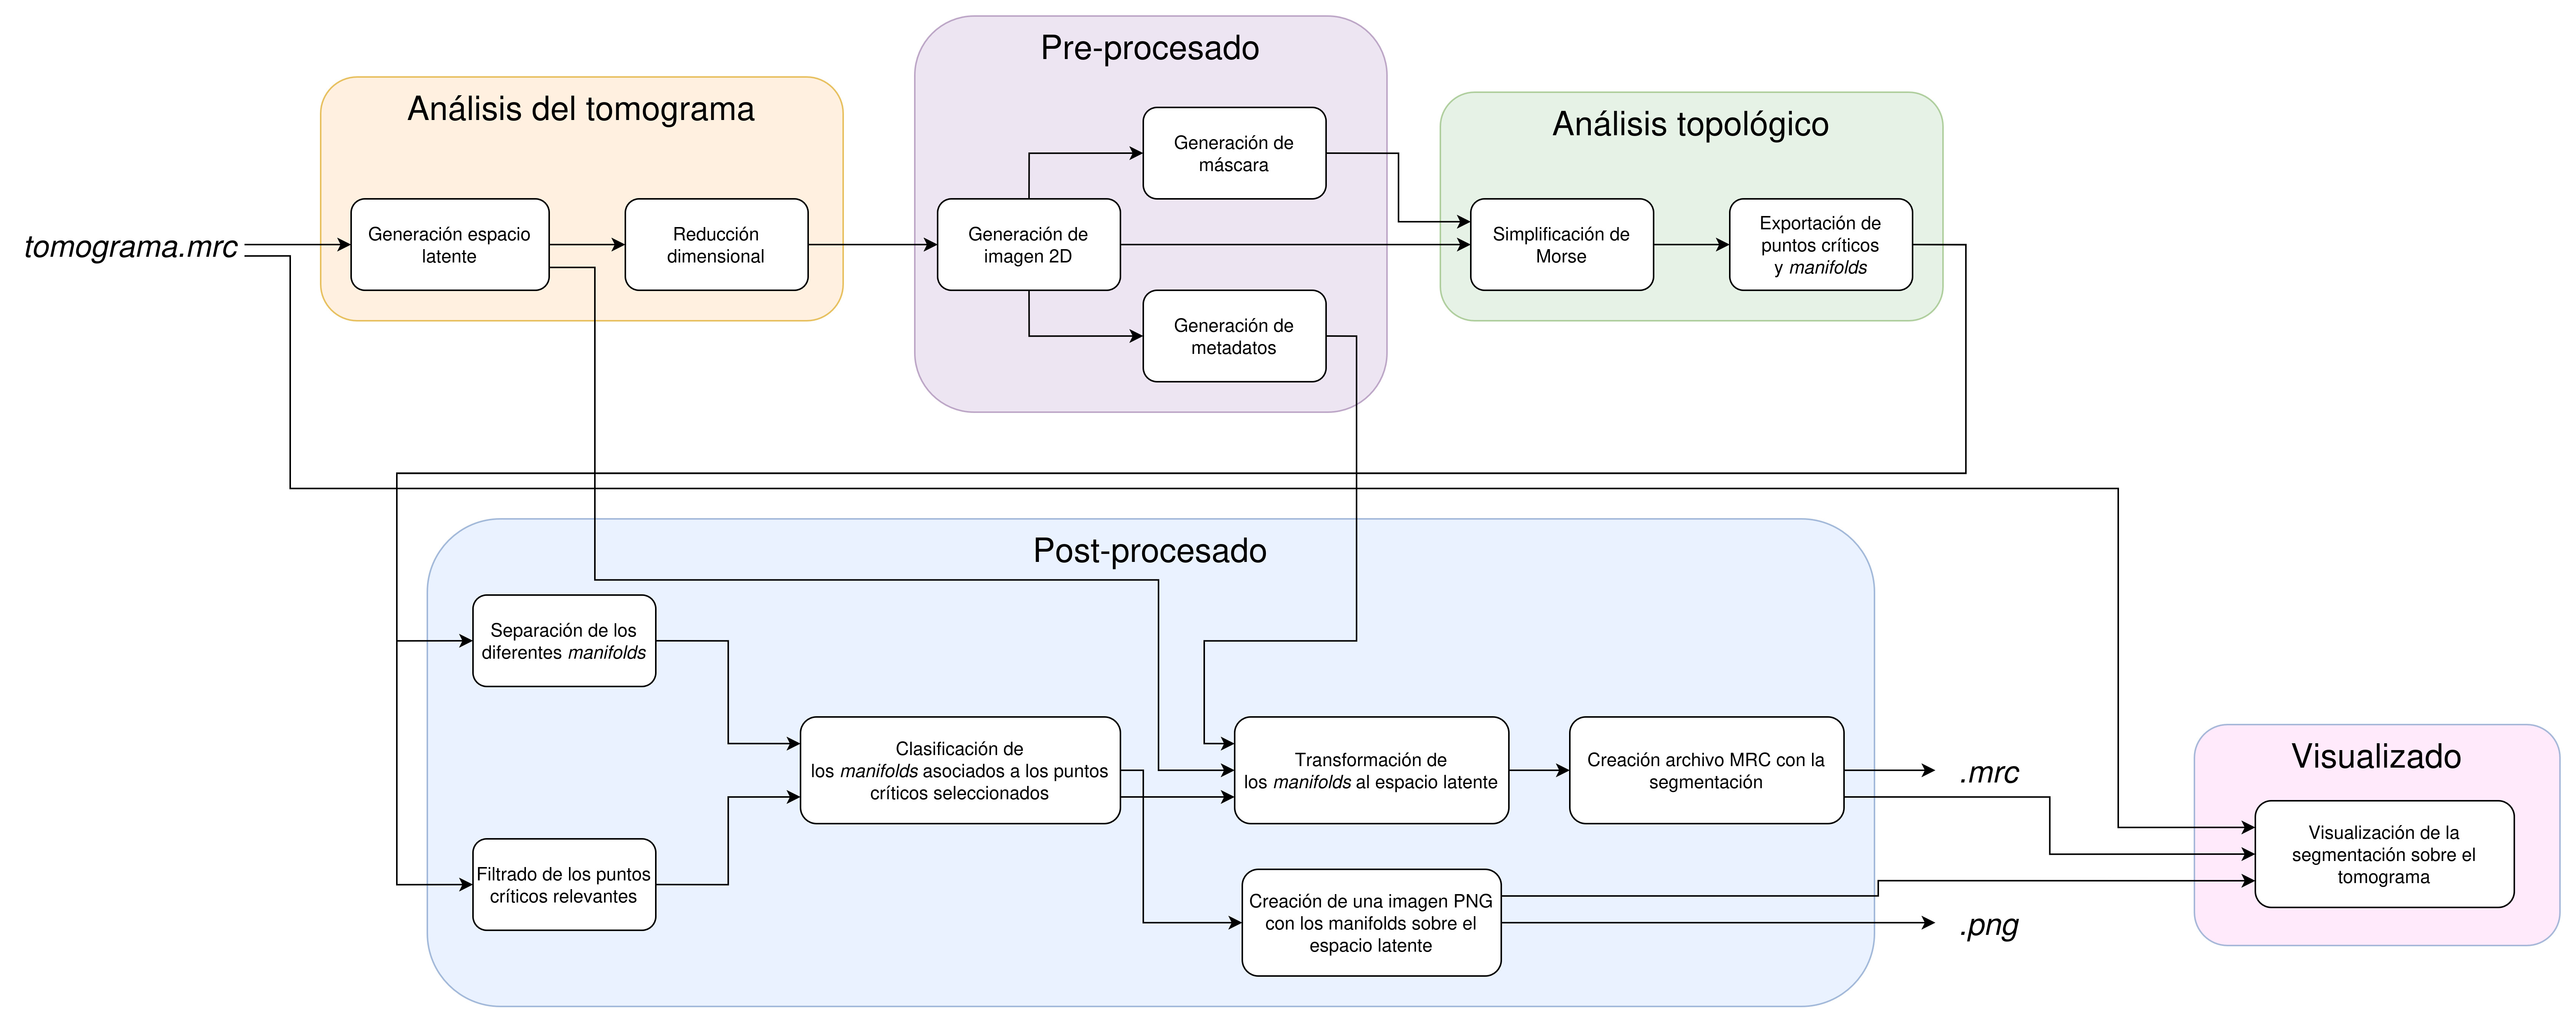
Auto-CryoET workflow diagram
About the project
This project is part of my Bachelor's Thesis (TFG) for my degree in Computer Engineering. Its goal is to automate the analysis of tomograms obtained through cryo-electron microscopy techniques. Its approach is to design a workflow that connects existing tools to create an automated, unsupervised process.
This work was a real challenge, as it draws on many fields of computer science such as image analysis, machine learning, and data analysis. This project allowed me to learn a great deal about data handling using Pandas and Numpy to manage large volumes of data. In addition, getting tools as different as TomoTwin and DisPerSE to work in harmony was quite a challenge.
Despite all the complications, I eventually managed to develop a terminal tool that runs an entire workflow autonomously. It only needs basic information about the neural network model and certain parameters for the tool to work. The tool's repository also details the installation process I created in order to distribute the tool conveniently among potential users. Although the details of the tool's development and implementation are complex and can be reviewed in the documentation, the different stages of the workflow are shown below with a brief description.
Workflow
Tomogram analysis
This is the first stage and handles the analysis of the input tomogram. The idea is to use the TomoTwin neural network to extract a 32-feature map for each point in the tomogram. Afterward, dimensionality reduction tools are used to obtain a 2D point cloud.
Preprocessing
This phase is developed entirely in Python and is responsible for generating a 2D image and a mask from the point cloud produced in the previous phase. These two elements will be crucial for DisPerSE to perform its topological analysis. This phase also provides the correspondence between the pixels of the image and the points of the point cloud.
Topological analysis
Using the DisPerSE tool, the image is analyzed to determine which areas of the point cloud are densest. These areas are the ones that will correspond to the structures in the original tomogram.
Postprocessing
This phase uses Python to transform the result of the previous phase back into the tomogram. We need to select which areas of the tomogram correspond to the areas of the image selected by the DisPerSE analysis. This allows us to obtain the segmentation we were looking for.
Visualization
This phase is optional and allows the tomogram segmentation to be visualized in a tool called Napari.
Poyect's screenshots
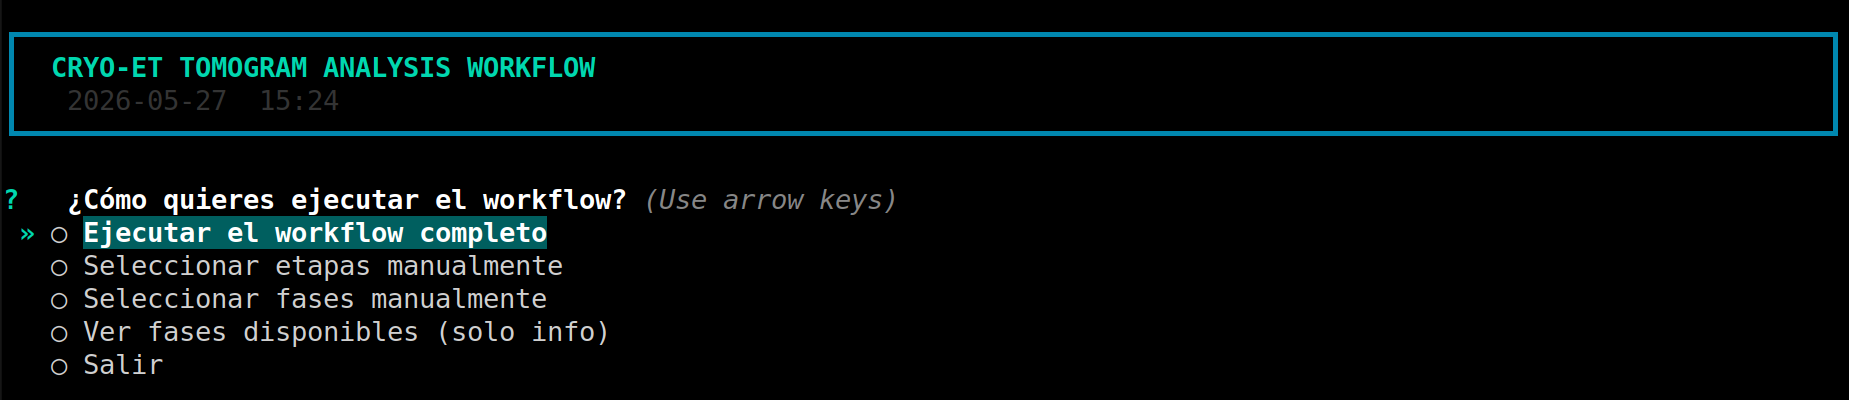
Initial menu in Auto-CryoET
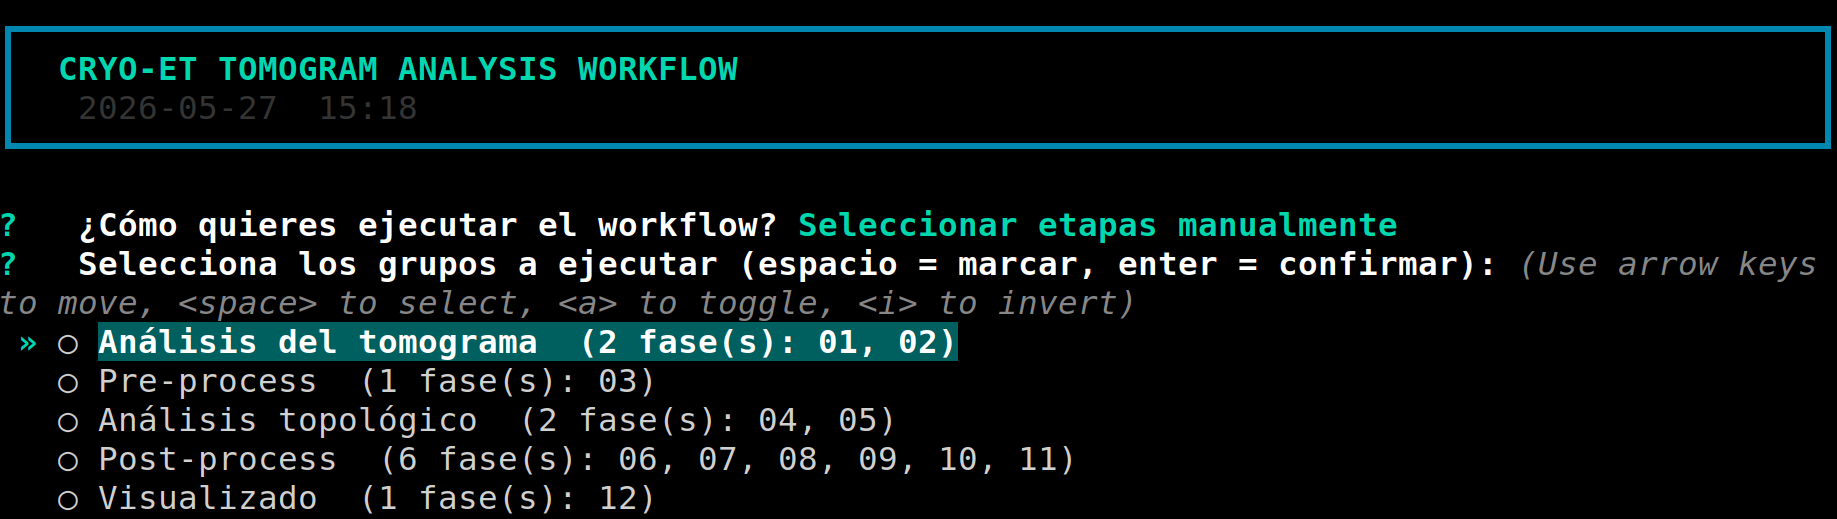
Stage selection menu in Auto-CryoET
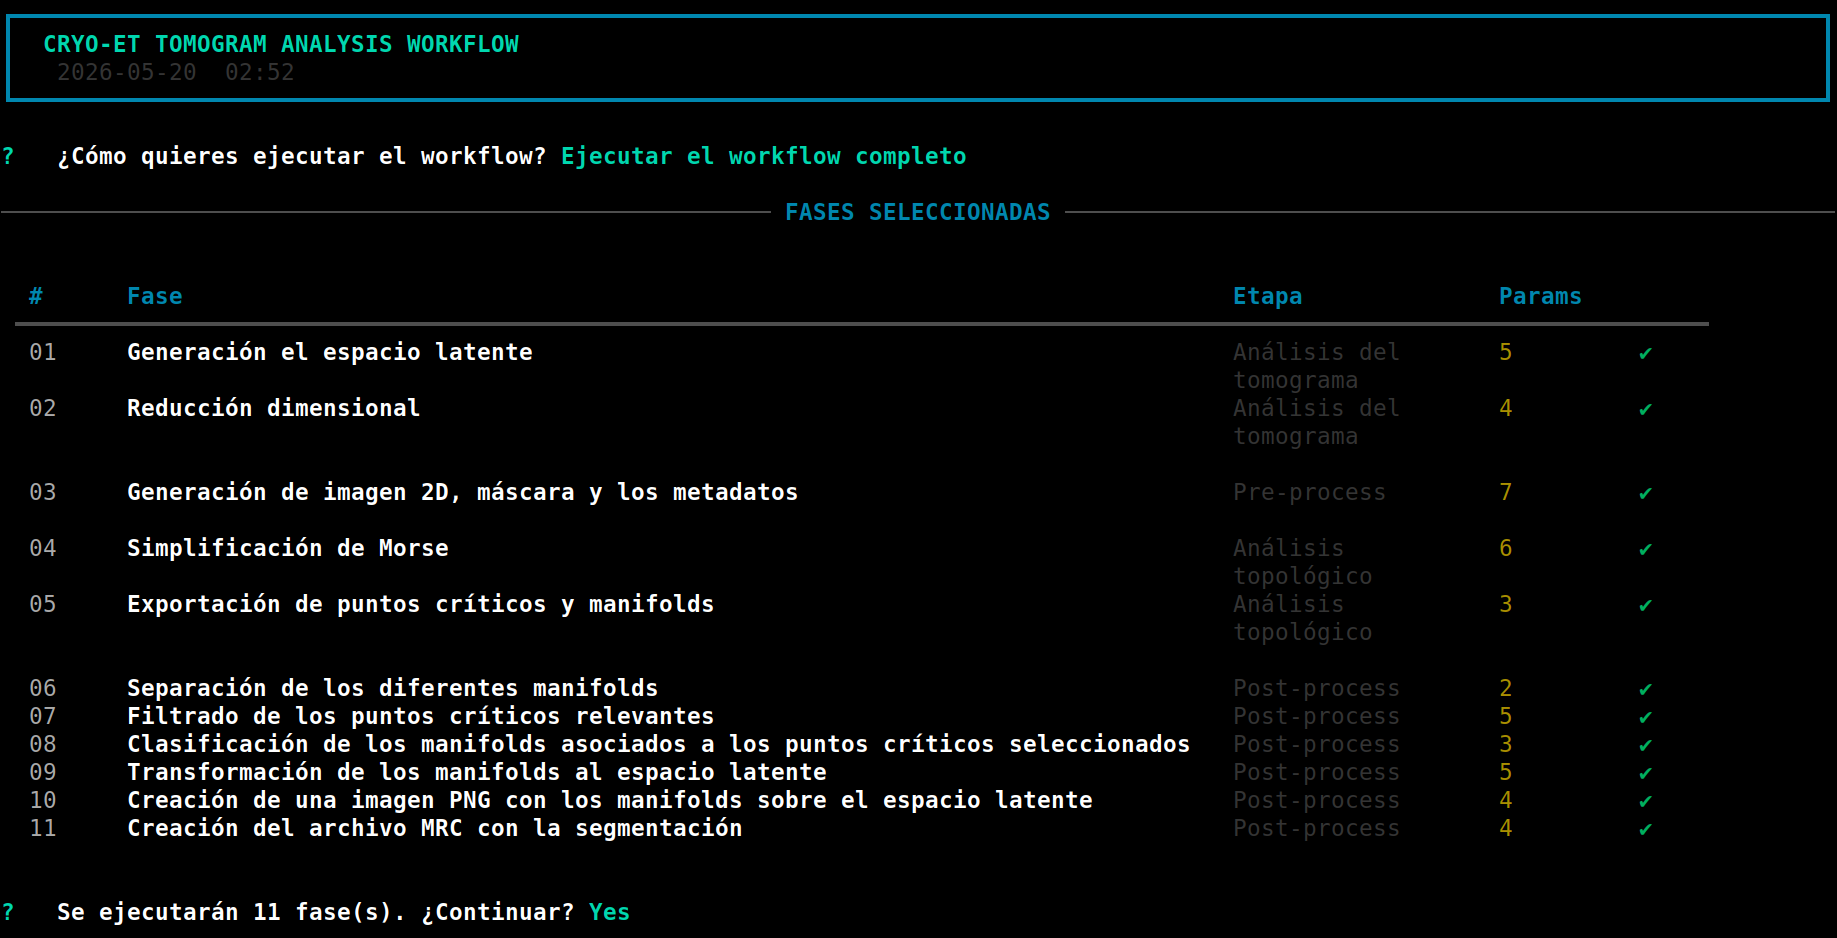
Summary of all workflow stages in Auto-CryoET
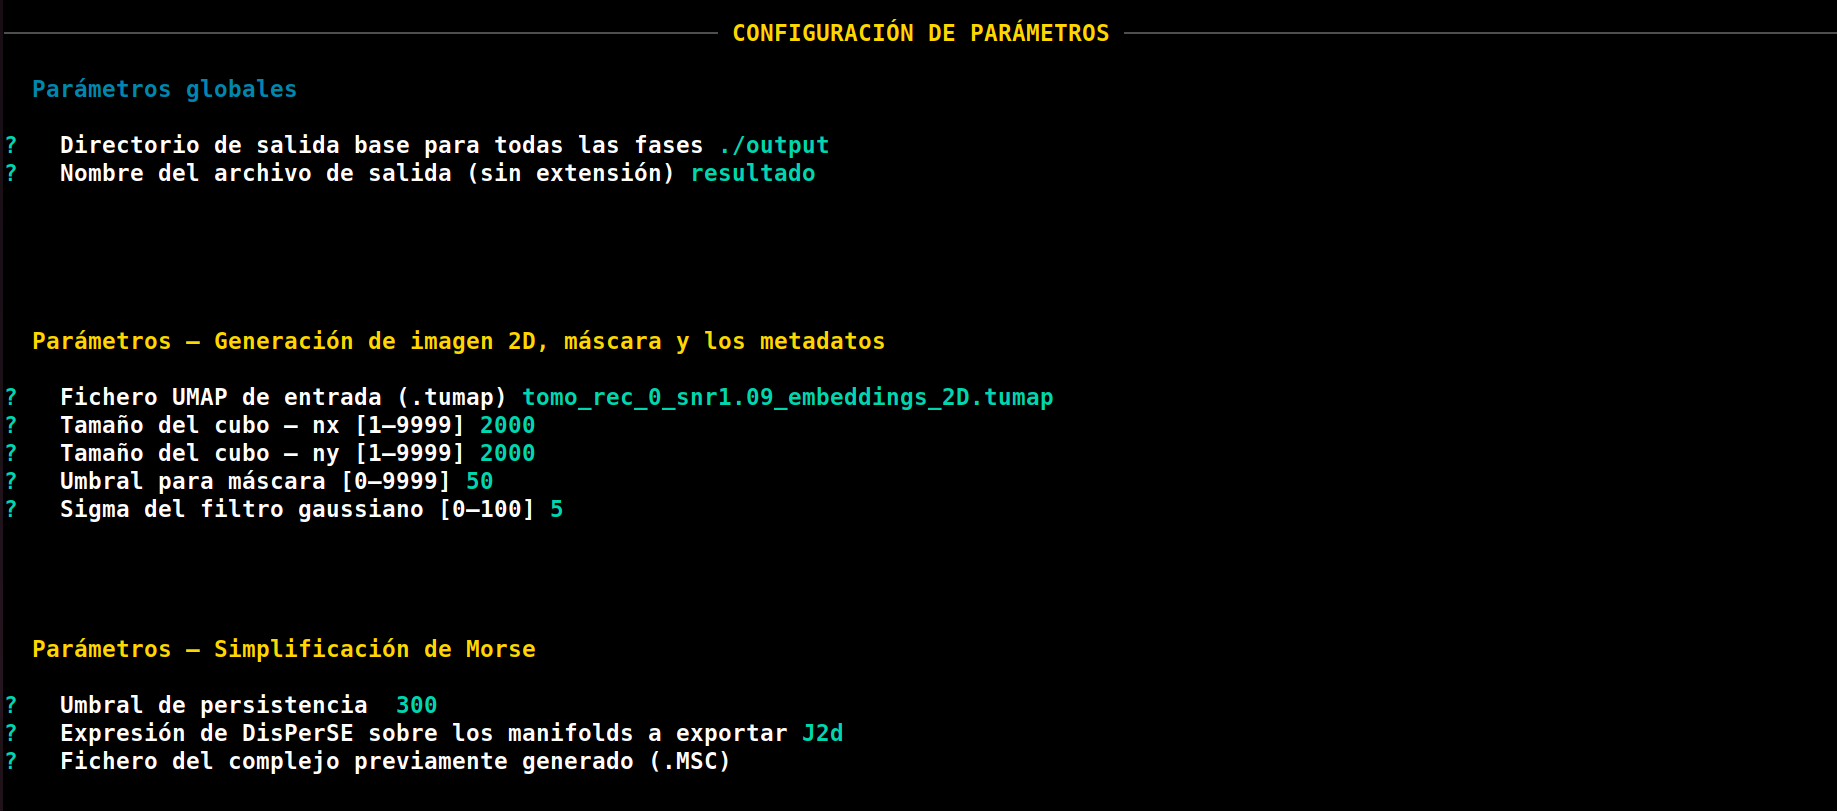
Auto-CryoET requesting parameters
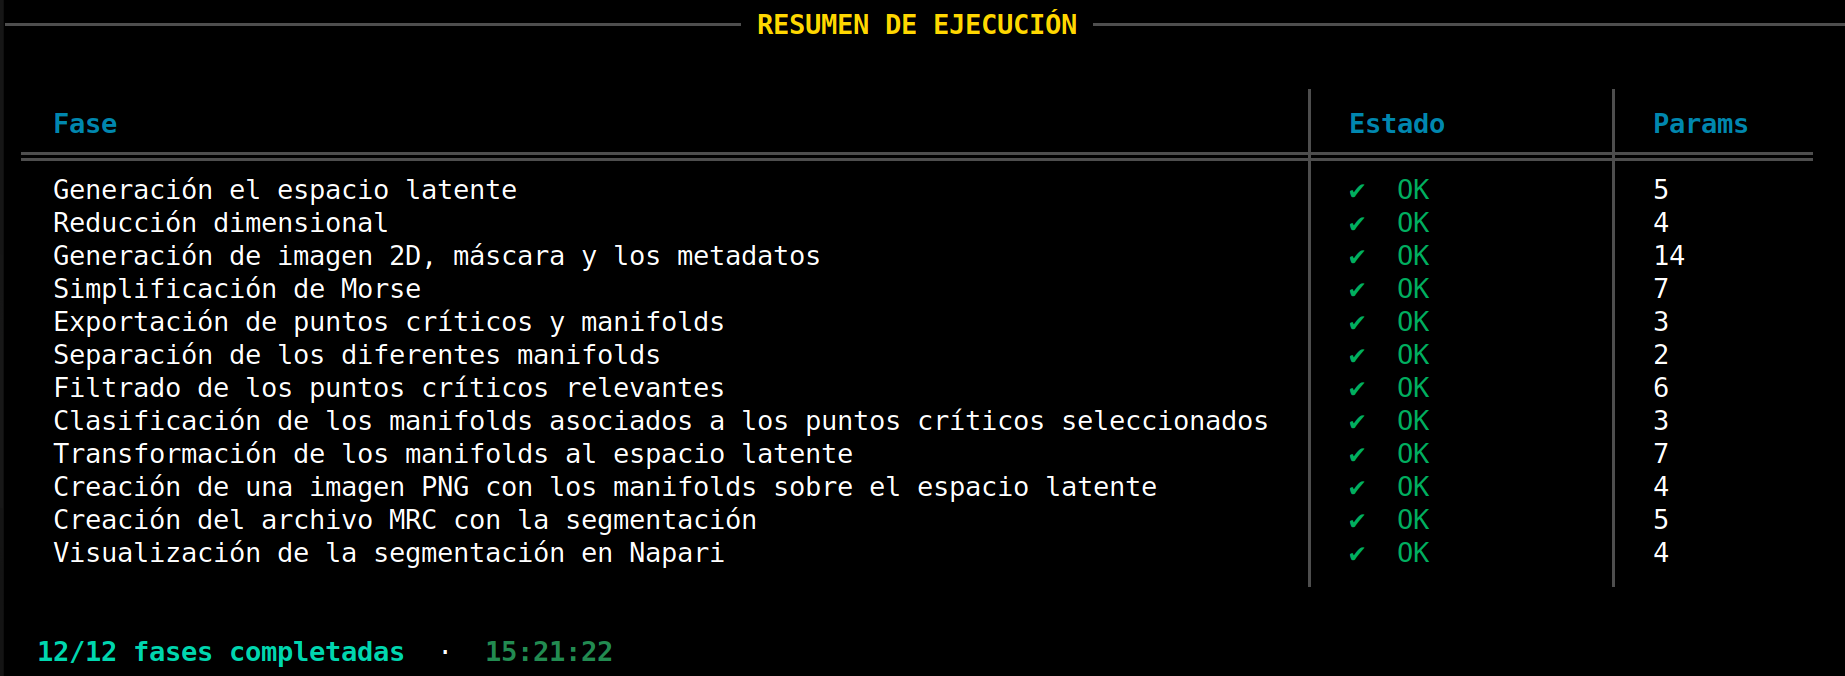
Successful execution of the full Auto-CryoET workflow